Hey Guys,
sometime before wipe, when I started playing again, I decided to gather some Information about Mission spawnpoints to find a good Base Spot for Mission Camping. Today I wanna share with you what I´ve found out and what surprised me a bit.
The Process:
To get all the information I wanted, I started noting the Faction (Hero/Bandit), Mission name, Coordinates as Grids and the difficulty, or color of the Mission. When I finished this I made a scatter plot with the Chernarus Map as background to get a decent overview of the spawnpoints. Over the time I documented 208 Missions which I used for the Charts below.
Mission Spawnpoints:
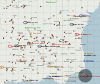
Maybe it will be helpful for new Players to see what the important spots are on the map and where there is maybe a more quite region to build and stay under radar. In the following Map you can see all the Spawnpoints of Misisons, which are marked by the orange squares:
Factions:
What really surprised me was that the gap between the Factions are that small, anytime I played (before wipe) I felt like Bandit Missions are done way more often then the Hero ones. In reality it was about 10% more Bandit Missions then Hero ones, which you can see in this pie chart:
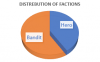
Bandit: 59%, Hero: 41%
Difficulty:
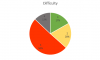
The Difficulty is the probably most uninteresting information in this post since you´ll notice that red Missions indeed have the most spawnquantity of all the Difficulties. So It´s not surprising that Black Missions are the ones with the least spawnrate (13%), followed by Green Missions (17%) and Yellow Missions (20%). Red Missions are with 50% the biggest part of the Missions and therefore the average Missiontype.
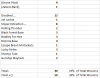
Also notable is that after there was a Black Mission, there always will be a Green Mission shortly after it:
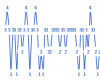
4 = Black Mission, 1 = Green Mission
So Anyways, maybe someone appreciate my Post and maybe someone even can use the data somehow. I´ll attach the .xlsx down here too if you wanna use the Data to find out for example which Missions spawned most or something like that.
With best Regardes,
Lars
Link to Data Sheet: Genesis Data.xlsx
sometime before wipe, when I started playing again, I decided to gather some Information about Mission spawnpoints to find a good Base Spot for Mission Camping. Today I wanna share with you what I´ve found out and what surprised me a bit.
The Process:
To get all the information I wanted, I started noting the Faction (Hero/Bandit), Mission name, Coordinates as Grids and the difficulty, or color of the Mission. When I finished this I made a scatter plot with the Chernarus Map as background to get a decent overview of the spawnpoints. Over the time I documented 208 Missions which I used for the Charts below.
Mission Spawnpoints:
Maybe it will be helpful for new Players to see what the important spots are on the map and where there is maybe a more quite region to build and stay under radar. In the following Map you can see all the Spawnpoints of Misisons, which are marked by the orange squares:
Factions:
What really surprised me was that the gap between the Factions are that small, anytime I played (before wipe) I felt like Bandit Missions are done way more often then the Hero ones. In reality it was about 10% more Bandit Missions then Hero ones, which you can see in this pie chart:
Bandit: 59%, Hero: 41%
Difficulty:
The Difficulty is the probably most uninteresting information in this post since you´ll notice that red Missions indeed have the most spawnquantity of all the Difficulties. So It´s not surprising that Black Missions are the ones with the least spawnrate (13%), followed by Green Missions (17%) and Yellow Missions (20%). Red Missions are with 50% the biggest part of the Missions and therefore the average Missiontype.
Also notable is that after there was a Black Mission, there always will be a Green Mission shortly after it:
4 = Black Mission, 1 = Green Mission
So Anyways, maybe someone appreciate my Post and maybe someone even can use the data somehow. I´ll attach the .xlsx down here too if you wanna use the Data to find out for example which Missions spawned most or something like that.
With best Regardes,
Lars
Link to Data Sheet: Genesis Data.xlsx